
Figure 2.
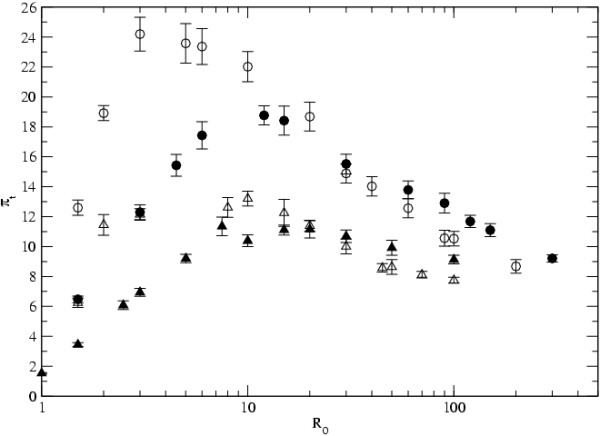
Diversity in the metapopulation. The level of diversity πt as a function of R0 = NdmK/e. The parameters values are D = 1000, Nd = 10, nt = 50 and μ = 0.0004. The empty symbols denote the results for the island model while the full symbols correspond to scale-free networks with γ = 3. The results for e = 0.01 are represented by circles and e = 0.02 by triangles.