
Figure 3.
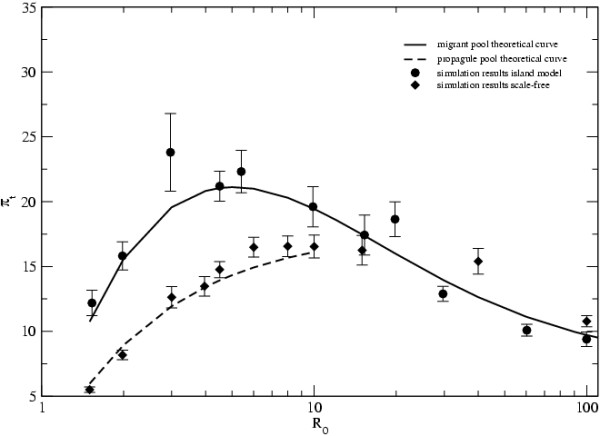
Theoretical approximations and the different topologies. Comparison of the level of diversity πt between topologies and with the theoretical approximations. D = 900, Nd = 10, e = 0.01, nt = 50 and μ = 0.0004 in all networks.
Official websites use .gov
A
.gov website belongs to an official
government organization in the United States.
Secure .gov websites use HTTPS
A lock (
) or https:// means you've safely
connected to the .gov website. Share sensitive
information only on official, secure websites.
Theoretical approximations and the different topologies. Comparison of the level of diversity πt between topologies and with the theoretical approximations. D = 900, Nd = 10, e = 0.01, nt = 50 and μ = 0.0004 in all networks.