
Figure 5.
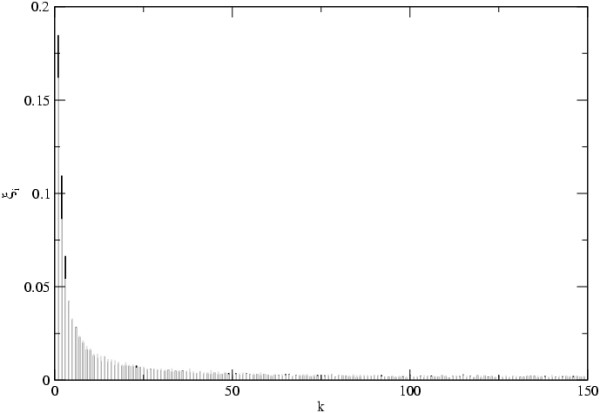
Frequency spectrum. The frequency spectrum of neutral mutations in scale free networks with γ = 3. In the Y-axis we plot the probability that in a sample of size nt = 300 we find mutations with frequency k/nt or with frequency (nt - k)/nt. D = 1000, Nd = 10, e = 0.01 and μ = 0.0004. Black bars correspond to R0 = 1.5 and grey bars to R0 = 15.