
Figure 4. Surface expression of ErbB-4 in NRG-stimulated neurons.
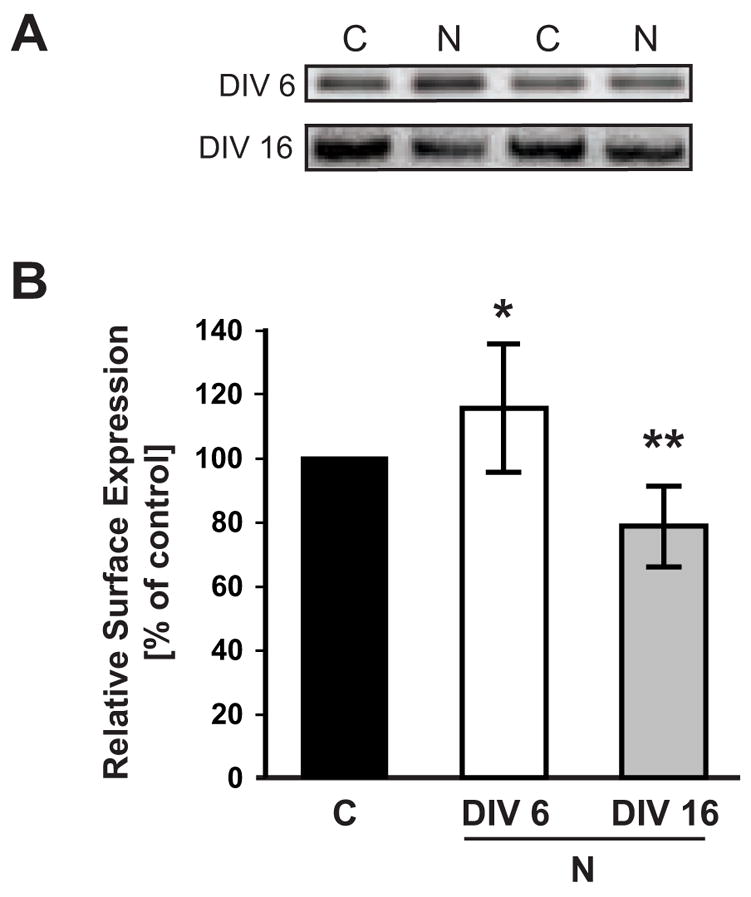
A, Representative Western blots of surface fractions from DIV 6 and DIV 16 neurons treated with 5 nM NRG1 peptide for 30 minutes and biotinylated as described in Figure 3. Two representative examples of surface ErbB-4 expression are shown for NRG-treated cultures (N) and vehicle-treated controls (C). B, Quantitative analysis of ErbB-4 surface expression in response to NRG peptide treatment. Surface ErbB-4 levels in controls were set as 100% (black bar), and compared to surface ErbB-4 levels after NRG treatment at DIV 6 (open bar) and DIV 16 (gray bar). Data represent the mean ± SD from 12 and 10 independent experiments for DIV 6 and DIV 16, respectively. *, p < 0.05; **, p < 0.01.