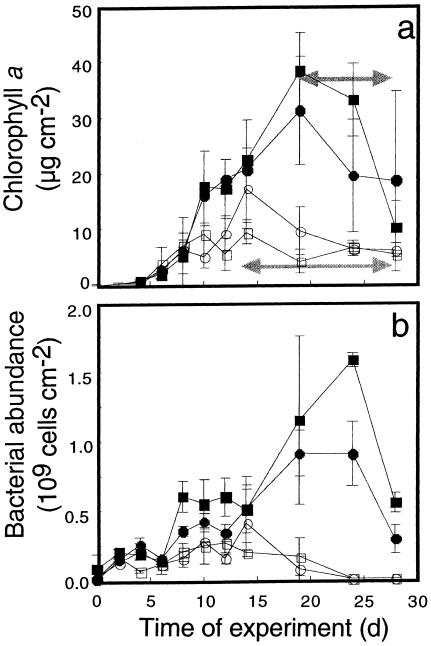
FIG. 1.
Developmental dynamics of microbial biomass as indicated by chlorophyll a (a) and bacterial abundance (b). Closed symbols denote slow-flow treatments, and open symbols denote fast-flow treatments. Horizontal arrows indicate periods of increased biofilm detachment and grazing. The results are averages ± the SDs of two to three coupons for each experimental flume.

