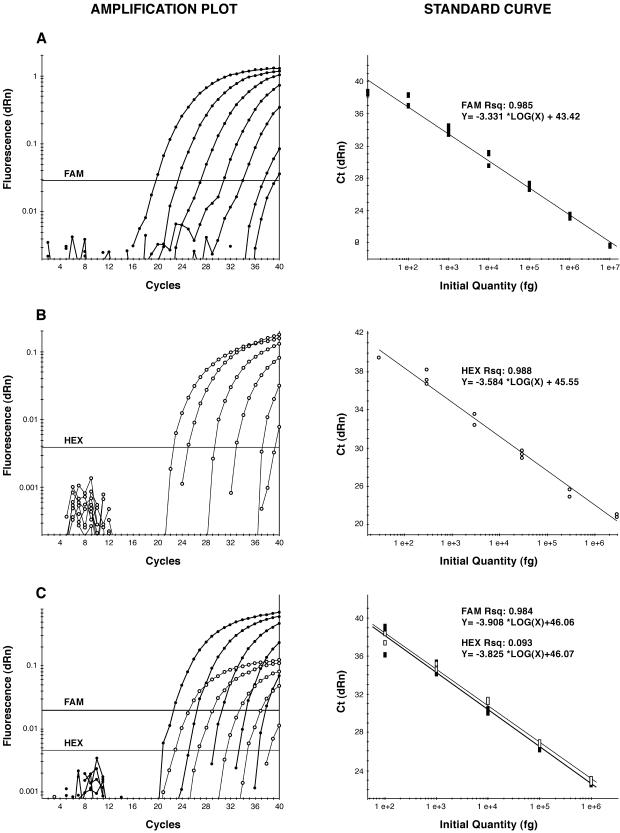
FIG. 1.
Simplex and multiplex detection of G. lamblia (solid symbols) and C. parvum (open symbols) using qPCR. The standard curves (right) correspond to the amplification plots (logarithmic view) on the left. (A) Tenfold serial dilutions of G. lamblia cyst DNA ranging from 10 ng to 1 fg and detection using β-giardin P241. (B) Tenfold serial dilutions of C. parvum oocyst DNA ranging from 5.7 ng to 5.7 fg and detection using the COWP primer-probe set P702. (C) Tenfold serial dilutions ranging from 1 ng to 100 fg of DNA from G. lamblia cysts and C. parvum oocysts and simultaneous detection using the β-giardin primer-probe set P241 and the COWP P702 set. The β-giardin probe was FAM labeled, and the COWP probe was HEX labeled. Horizontal lines show thresholds. dRn, baseline-corrected normalized fluorescence; RSq, R2 (indication of the fit of the standard curve to the standard data points plotted).

