
Figure 1.
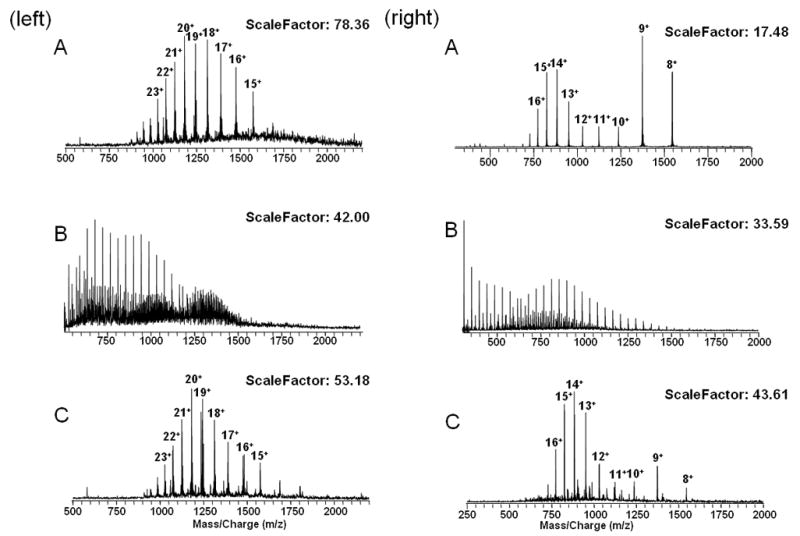
(left) A. ESI spectrum of 2 μM α-casein. B. ESI spectrum of 2 μM α-casein with 20 μM PEG 4000. C. ESI spectrum of 2 μM α-casein with 20 μM PEG 4000 after TiO2 cleanup. (right) A. ESI spectrum of 2 μM cytochrome c. B. ESI spectrum of 2 μM cytochrome c with 20 μM PEG 4000. C. ESI spectrum of 2 μM cytochrome c with 20 μM PEG 4000 after TiO2 cleanup. Scalefactor is inverse proportion to intensity, and baseline noise is constant so that signal/noise is a valid measure of relative intensity.