Figure 2.

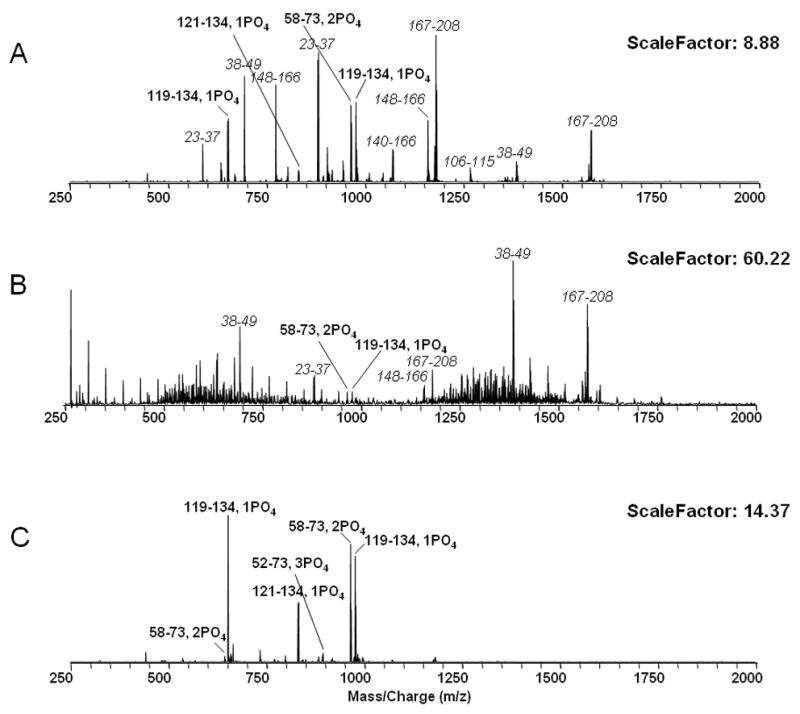
A. ESI spectrum of 1 μg α-casein tryptic digest. B. ESI spectrum of 1 μg α-casein tryptic digest with 20 μM PEG 4000. C. ESI spectrum of 1 μg α-casein tryptic digest with 20 μM PEG 4000 after TiO2 cleanup.

A. ESI spectrum of 1 μg α-casein tryptic digest. B. ESI spectrum of 1 μg α-casein tryptic digest with 20 μM PEG 4000. C. ESI spectrum of 1 μg α-casein tryptic digest with 20 μM PEG 4000 after TiO2 cleanup.