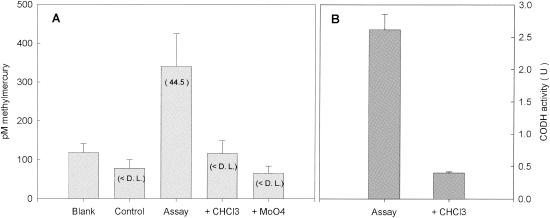
FIG. 3.
(A) Methylmercury concentrations produced after a 5-h HgCl2 incubation in D. multivorans inhibition experiment. Blank corrected methylation rates (picomolar concentration per hour) are in parentheses. D.L., detection limit. (B) CODH activity measured for noninhibited and inhibited cultures during methylation assay. Error bars represent the standard deviation of three replicate assays.

