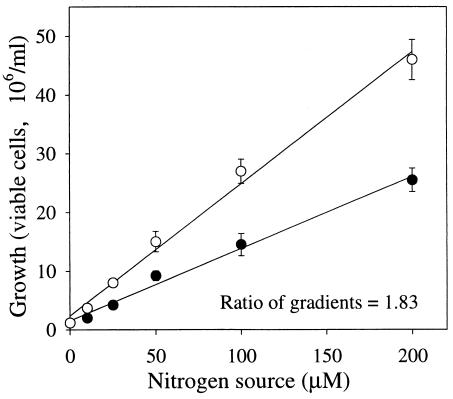
FIG. 2.
Growth of Pseudomonas sp. strain FA1 at various concentrations of CL-20 (○) and (NH4)2SO4 (•). The viable-cell count in early-stationary-phase culture (16 h) was determined for each nitrogen concentration. The linear-regression curve for (NH4)2SO4 has a gradient of 0.122 and an r2 of 0.990. The linear-regression curve for CL-20 has a gradient of 0.224 and an r2 of 0.992. Data are means of results from duplicate experiments, and error bars indicate standard errors. Some error bars are not visible due to their small size.

