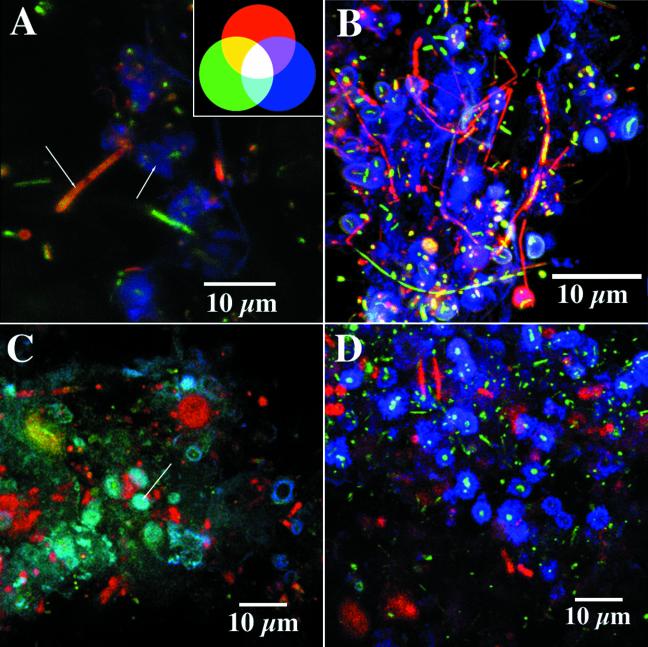
FIG. 2.
Triple-labeled confocal images of different biofilm samples illustrating the distribution of protein, nucleic acids, lipid, and polysaccharide regions labeled with N-acetylglucosamine- and N-acetyllactosamine-sensitive lectins. Colors denote the following: (A) protein (red), nucleic acids (green), polysaccharide (blue) (arrow indicates filamentous structure with protein plus nucleic acids); (B) lipid (red), nucleic acids (green), polysaccharide (blue); (C) lipid (red), protein (green), and polysaccharide (blue) (arrow indicates cyan region where colocalization of protein and polysaccharide was detected); (D) polysaccharide (red), nucleic acids (green), and polysaccharide (blue)—in this case, the two lectins are localized in distinct polysaccharide regions.

