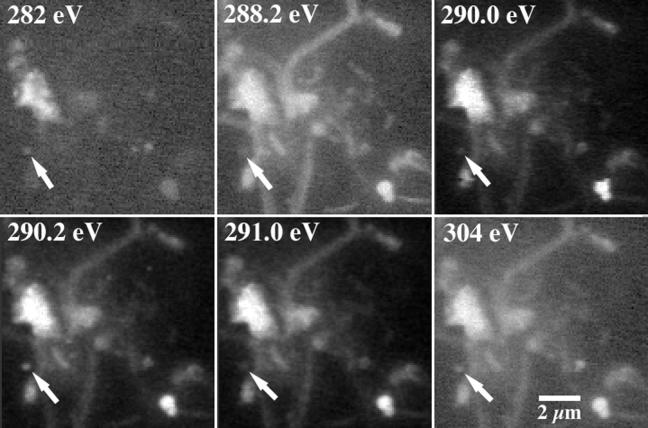
FIG. 6.
STXM images of a biofilm at selected photon energies: at 282 eV, below C 1s onset; at 288.2 eV, protein π*; at 290.2 eV, CaCO3 π*; at 290.0 and 291.0 eV, adjacent images are shown to demonstrate the sensitivity of STXM to small energy changes; 304 eV, C 1s continuum. The as-recorded transmission images have been converted to optical density (absorbance). The contrast variation is associated with differences in the X-ray absorption of various chemical components at these energies and provides the basis for quantitative chemical mapping.

