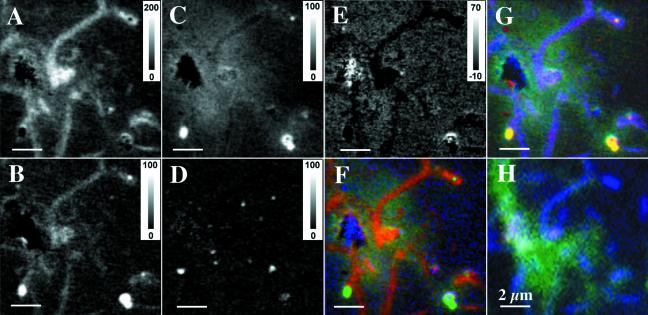
FIG. 7.
Grey-scale STXM maps of protein distribution (A), lipid distribution (B), saccharide distribution (C), carbonate distribution (D), and nucleic acid distribution (E) in the biofilm derived by fitting individual pixels in an 81-image sequence in the C 1s region to the spectra presented in Fig. 4. Color-coded composite maps of proteins (red), saccharides (green), and nucleic acids (blue) (F) and of lipids (red), saccharides (green), and proteins (blue) (G) were all derived from the STXM image sequence of the biofilm. (H) The same region imaged with confocal fluorescence microscopy using probes for fucose EPS (green) and nucleic acids (blue). Note that the strong DNA signal in panel F is most likely an artifact associated with absorption saturation at those points. Bars, 2 μm.

