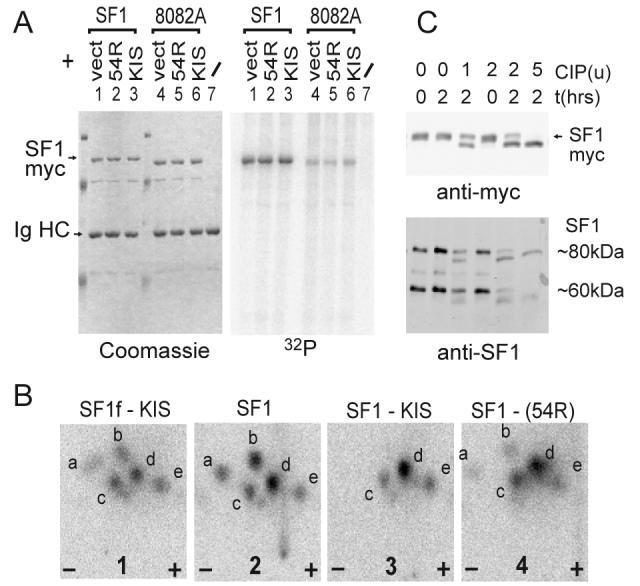
Figure 3. SF1 SPSP motif phosphorylation in cells.

A) HEK293 cells were transfected with SF1myc or SF1myc(8082A) together with either pCDNA3 (vect), pCDNA3-KIS(54R) (kinase defective) or pCDNA3-KIS. Overexpressed SF1myc was immunoprecipitated with antimyc mAb 9E10 and analysed by SDS PAGE, coomassie staining (left) and phosphorimaging (right).
B) Phosphorylated SF1 was analysed by tryptic phosphopeptide mapping. Map 1: SF1f phosphorylated by KIS in vitro (with a moderate stoichiometry of about 0.1 phosphate per SF1 molecule). Maps 2, 3 and 4 : phosphorylated SF1myc from lanes 1, 3 and 2 of gel in A. SF1f and SF1myc present almost identical maps showing that major phosphorylation occurs on the SPSP motif in vivo. Coexpression of KIS leads to disappearance of the more basic a and b peptides (two experiments) indicating an increase in the phosphorylation state of the SPSP motif.
C) 5 μg of protein extract of HEK293 cells overexpressing SF1myc (top) or of untransfected HEK293 cells (bottom) were analysed by phosphatase (CIP) treatment with the different amounts indicated (units from New Englands Biolabs) and western blotting with antimyc or antiSF1 antibody (Cemines). In additional characterization experiments we showed that the 80kDa band migrated just below SF1myc, was nuclear and heat soluble which are characteristics of SF1 [53]. The 60kDa band most probably corresponds to a differentially spliced form [28].
