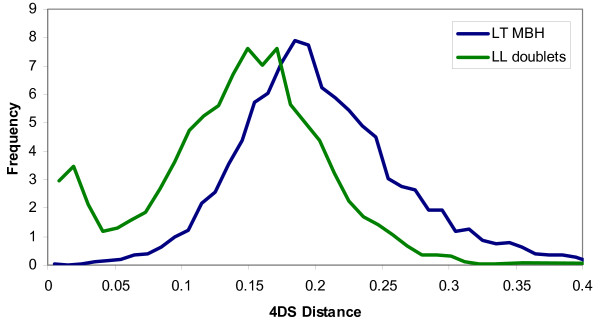
Figure 5.
4DS distances identify genome duplication event. Histograms of the 4DS distances for the 9905 mutual highest scoring L-T pairs (blue line) as well as for the 3358 unambigous L-L pairs (red bars). The L-L pairs with 0.05 < 4DS < 0.25, peaking around 0.16, are selected as originating from the genome duplication event.

