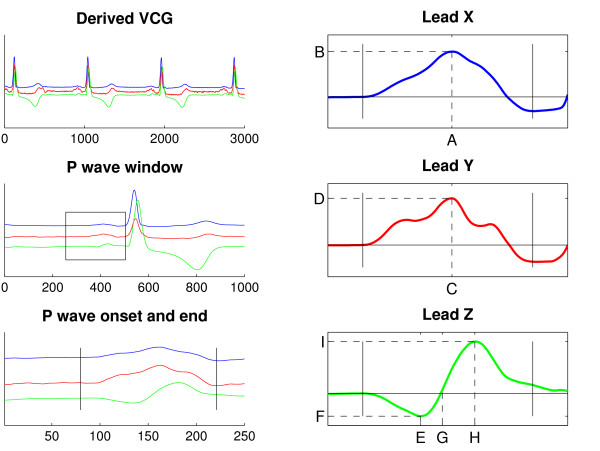
Figure 2.
P wave data acquisition and P wave parameters. A schematic illustration of the method used for acquiring P wave data. After obtaining the derived leads, a QRS detection algorithm was applied. A data window of 250 ms preceding the QRS complex was created, supposedly containing the P wave. The window could be manually redefined if necessary. The data window was time-shifted and P waves then merged and averaged. P wave onset and end were set manually. The following P wave parameters were studied: location and amplitude of maximum in Lead X (X max pos, X max [A and B in the figure]), location and amplitude of maximum in Lead Y (Y max pos, Y max [C, D], location of zero crossing in Lead Z (Z zero pos [G]), and location and amplitude of minimum and maximum in Lead Z (Z min pos, Z min, Z max pos, Z max [E, F, H, I]. P wave onset and end are marked by vertical bars.

