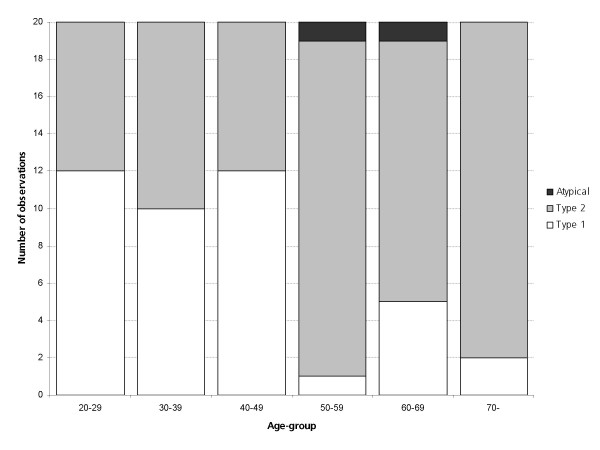
Figure 3.
Distribution of P wave Type 1 and 2 in different age groups. The study population was evenly distributed in decades. In the diagram, the distribution of P wave morphology types is shown for different age groups. P waves of Type 1 (white) are more common in the younger population and those of Type 2 (shaded) are significantly more common in the older age groups. Two cases of atypical P wave morphologies (dark grey) were also observed.

