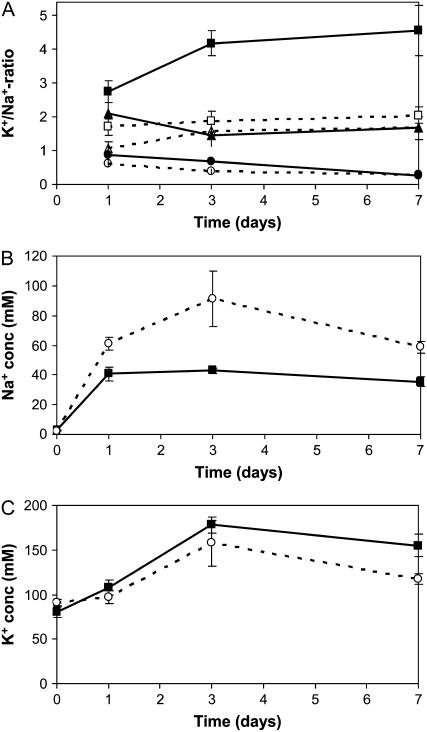
Figure 4.
The intracellular K+-to-Na+ ratio of wild-type and ena1 plants exposed to varying NaCl concentrations. A, Five-week-old gametophytes of wild type (black; n = 6) and ena1 (stippled; n = 9) were exposed to 100 (square), 200 (triangle), or 400 mm (circle) NaCl for up to 7 d. The data for ena1 represent the average for three independent ena1 lines. Intracellular Na+ (B) and K+ (C) concentrations in wild-type (black) and ena1 gametophytes (stippled) were calculated after exposure to 100 mm NaCl. Water content of the tissue was determined by weighing the gametophytes before and after drying.

