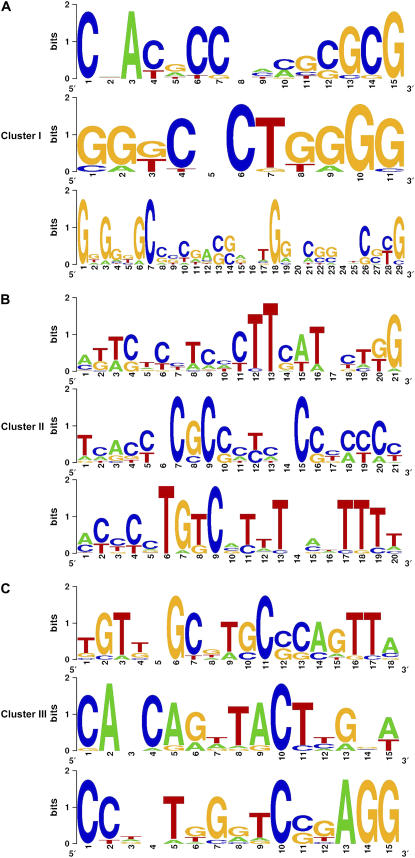
Figure 2.
Putative cis-acting regulatory elements enriched in the stigma-specific or preferential genes. A to C, The top three candidate motifs of cluster I, cluster II, and cluster III, respectively. The overall height of each stack indicates the sequence conservation at that position (measured in bits), whereas the heights of symbols within the stack reflect the relative frequencies of the corresponding nucleic acids at that position.

