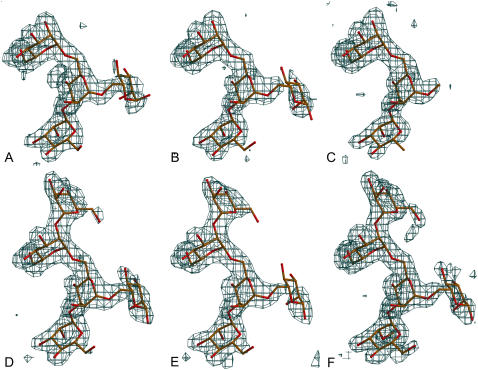
Figure 2.
Different electron density maps for all of the oligosaccharides used in this study as observed in the binding site of monomer B. All maps were calculated by removing the sugar residues from the final coordinates and applying one round of slow-cool refinement to remove potential bias of Man-9 and drawn at a level of 3 σ. The atomic model is superimposed. A, Man-5. B, Man-6. C, Man-7D1. D, Man-7D3. E, Man-8D1D3. F, Man-9. [See online article for color version of this figure.]

