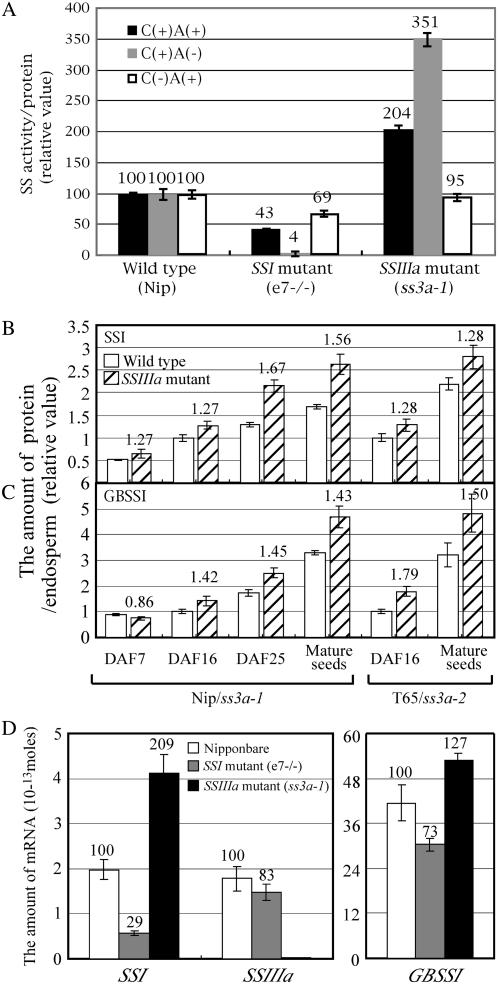
Figure 4.
A, Total SS activity of the crude extract from developing endosperm in wild type ‘Nip’, the SSI mutant (e7−/−), and the SSIIIa mutant (ss3a-1). The SS activity was assayed in the presence (+) or absence (−) of 0.5 m citrate (C) and exogenous primers (2 mg/mL rice amylopectin; A), as indicated. The numbers on the graph are the percent of the activity in the SSI and SSIIIa mutants under each condition when the activity of ‘Nip’ was defined as 100%. The data are the mean ± se of three seeds. B and C, Amount of SSI (B) or GBSSI (C) protein in developing rice endosperm from DAF 7 through to the mature endosperm of the wild type ‘Nip’ and ‘T65’ and the SSIIIa mutant (ss3a-1 and ss3a-2). The total amount of three fractions (SP, LBP, and TBP; see “Materials and Methods”) of SSI or GBSSI protein was quantified by immunoblotting using antiserum raised against SSI or GBSSI (Fujita et al., 2006). The numbers on the graph are the rate of the amount of protein in SSIIIa mutants to that of the total SSI or GBSSI protein in the wild type. The data are the mean ± se of three seeds. D, Amount of mRNA of SSI, SSIIIa, and GBSSI genes in developing rice endosperm (DAF 10) of the SSI (e7) and SSIIIa (ss3a-1) mutants and the wild type (‘Nip’). The numbers on the graph are the percent of the amount of mRNA in the SSI and SSIIIa mutants when ‘Nip’ was defined as 100%. The data are the mean ± se of three replications.

