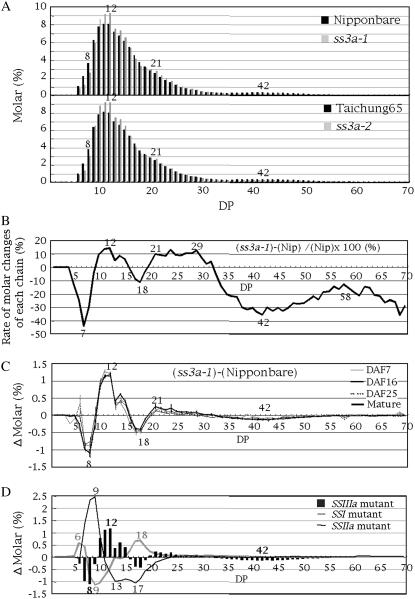
Figure 7.
A, Chain-length distribution patterns of endosperm amylopectin in the mature endosperm of SSIIIa mutant lines (ss3a-1 and ss3a-2) and the wild-type parent ‘Nip’ and ‘T65’. B, Rate of molar changes of each chain relative to the amount of its chain (Δmolar %/molar % × 100), as calculated from A for DP 5 to 60 amylopectin chains of the SSIIIa mutant (ss3a-1). C, Differences in the chain-length distribution patterns of amylopectin in developing endosperm at DAF 7, 16, and 25 and the mature endosperm of the SSIIIa mutant line ss3a-1 and wild-type ‘Nip’. Vertical bars indicate ses. D, Comparison of differences in the chain-length distribution pattern (Δ molar %) among SS mutant lines (SSIIIa, SSI, and SSIIa). Values for the molar % in A and Δ molar % in B, C, and D for each DP are averages of three seeds arbitrarily chosen from a single homozygous plant. The numbers on the plots are the DP values.

