
Figure 4.
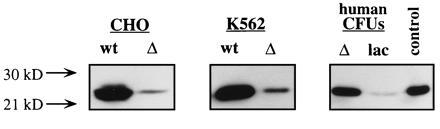
Western blot analysis of human AGT expression. Protein extracts from CHO cells (lanes 1 and 2) transfected with wtMGMT and ΔMGMT and K562 cells (lanes 3 and 4) and pooled human hematopoietic progenitors (lanes 5 and 6) transduced with wtMGMT, ΔMGMT, or lacZ were separated on a 10% SDS/PAGE gel. Blots were immunoreacted with monoclonal antibody mT3.1, and the 22-kDa human AGT was visualized by chemiluminescent substrate. AGT activity was estimated by correlation of band intensity to a protein extract expressing known levels of AGT (lane 7).