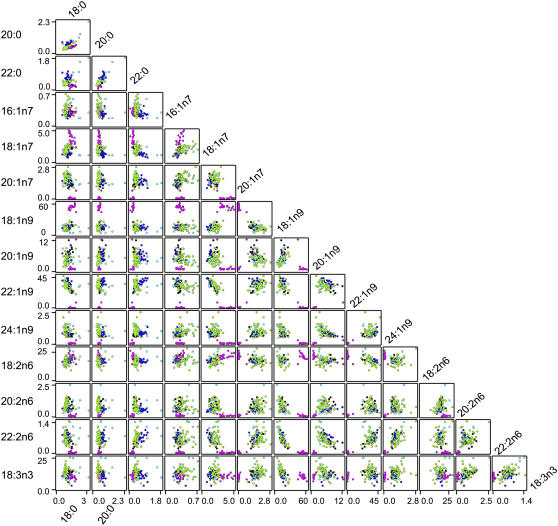
Figure 3.
Matrix of scatter plots indicating correlations between the percentage contribution of each fatty acid to the total content of the different triacylglycerols. Colored dots represent individual line taxa, coded as follows: Non-oleifera B. napus, black; B. napus var. olifera, magenta; B. oleracea, green; B. rapa, blue; Brassica Wild sp., cyan. The scale for each fatty acid is indicated on the x and y axis, from zero to the maximum value indicated. Each plot shows the levels of one fatty acid compared to another with the respective scales shown on each axis. Those fatty acids with amounts below 0.5% are not shown.

