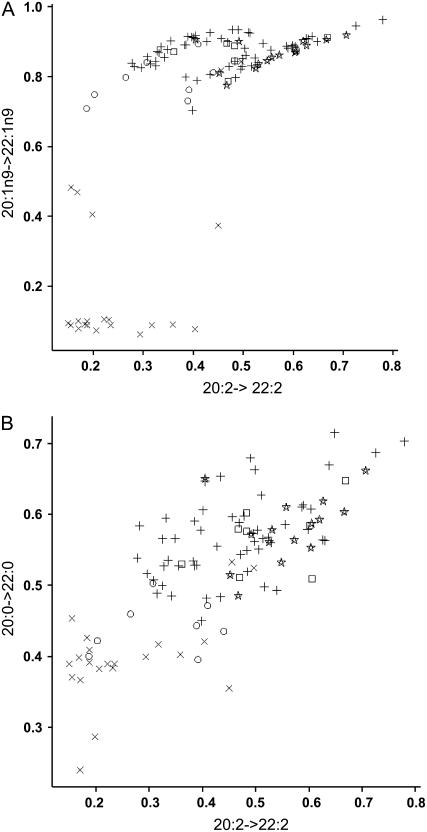
Figure 4.
Comparison of step yields calculated for different elongase enzymes. Inferred relative yields of two elongations are plotted for each line sampled. Yields were calculated according to the equation in “Materials and Methods.” A, y axis: 20:1n9->22:1n9, inferring activity of FAE (e2), x axis: inferred activity of 20:2-> 22:2 (FAE f2). B, y axis: 20:0->22:0 inferred activity of FAE (c2), x axis: 20:2->22:2 inferred activity of FAE (f2). The symbols represent the different taxa groupings. x, Modern oilseed B. napus; ○, nonoilseed B. napus; +, B. oleracea; ⋆, B. napus; □, wild species.

