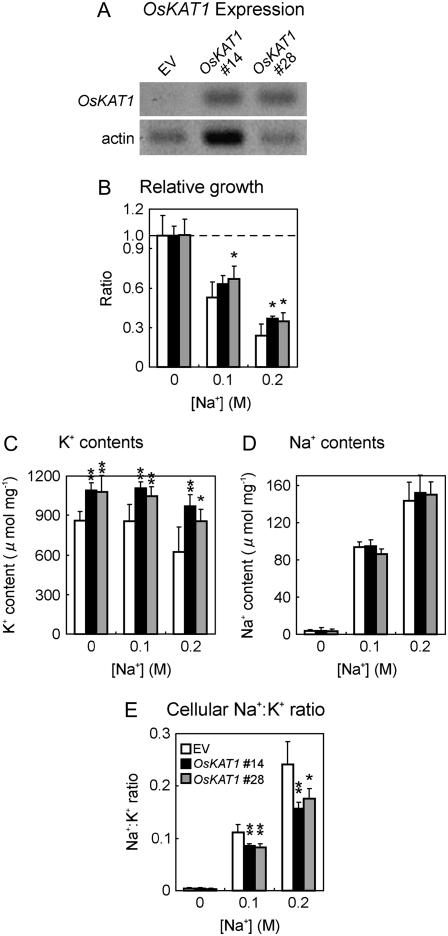
Figure 5.
Growth and cellular cation contents of the transgenic rice cells during salinity stress. Rice cell lines transformed with OsKAT1 expression plasmid (OsKAT1 #14, black bars; #28, gray bars) and EV (white bars) were cultured for 10 d in Murashige and Skoog medium containing 0, 0.1, or 0.2 m NaCl. A, RT-PCR analysis of OsKAT1 expression. B, Effects of salt stress treatment on the growth of rice cells. Relative growth is shown as ratio of cellular fresh weight in 40-mL culture suspension to that of cells grown in medium without NaCl. C, K+ contents of cells. D, Na+ contents of cells. E, Ratio of Na+ and K+ contents in cells. Each value is the mean ± sd of six samples in two independent experiments. Asterisks represent significant differences between the EV and OsKAT1 (*, P <0.05; **, P < 0.01; t test was performed in Microsoft Excel).

