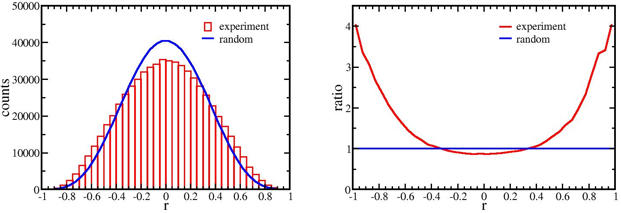
Figure 1. Distribution of correlation coefficients.

(A) The histogram consists of 40 bins ranging from −1 to 1. (B) The ratio of number of correlation coefficients in the experimental data to the random case for bin in Figureô 1A. At high correlations, the number of microRNA-mRNA pairs is larger than expected in the random case. This result suggests information exists in the correlation coefficients between miRNAs and mRNAs.
