
Figure 3. Histogram of P values from the WRS test for each of the miRNAs.
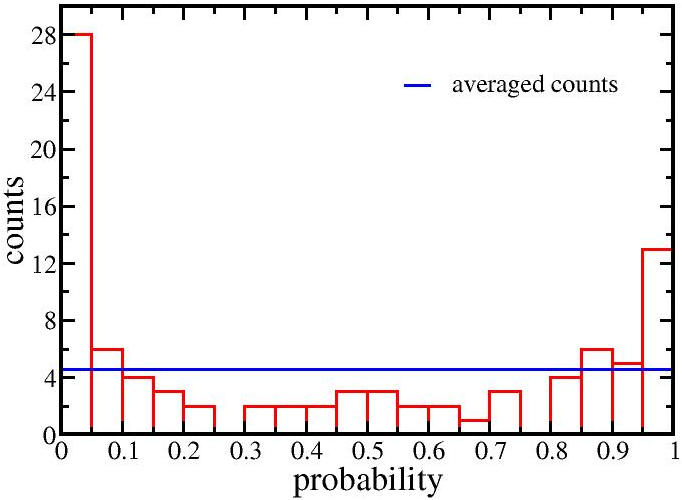
The WRS test compared the correlations of the predicted targets with that of the non-predicted ones for each of the 91 miRNAs. As the correlation went from negative to positive the percentage of predicted target pairs decreased. Interestingly, some highly positively correlated miRNAs had high P values, which suggests an indirect relationship with the predicted target.