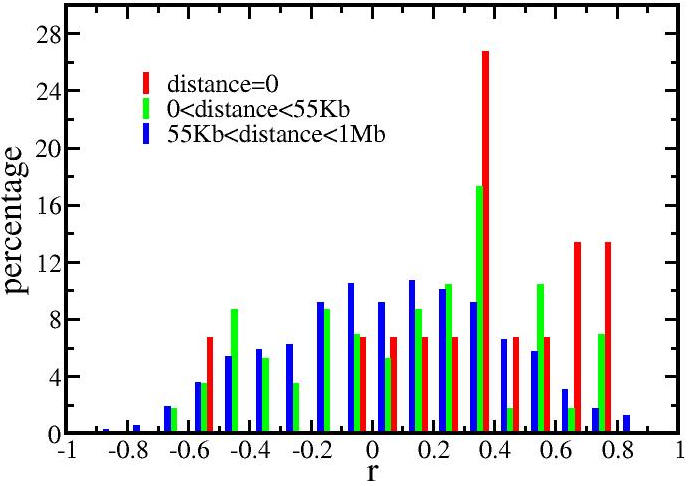
Figure 4. Distribution of correlations between miRNAs and proximate mRNAs.

This figure showed the distributions for 3 groups of miRNA-mRNA pairs, classified by the distance between a miRNA and an mRNA on the same chromosome. The y-axis shows the percentage of miRNA-mRNA pairs in each range of correlation (−1 to 1 with binsize 0.1). An intronic miRNA had a distance zero to its host gene. The average length of a human gene, 55Kb (http://www.ncbi.nlm.nih.gov/Web/Newsltr/Spring03/human.html), was chosen as one distance boundary. As the distance between the correlated pair increased, the distribution increasingly shifted away from positive correlations to a normal distribution.
