
Figure 3. Gonad contractility of ppk-1 (RNAi) animals.
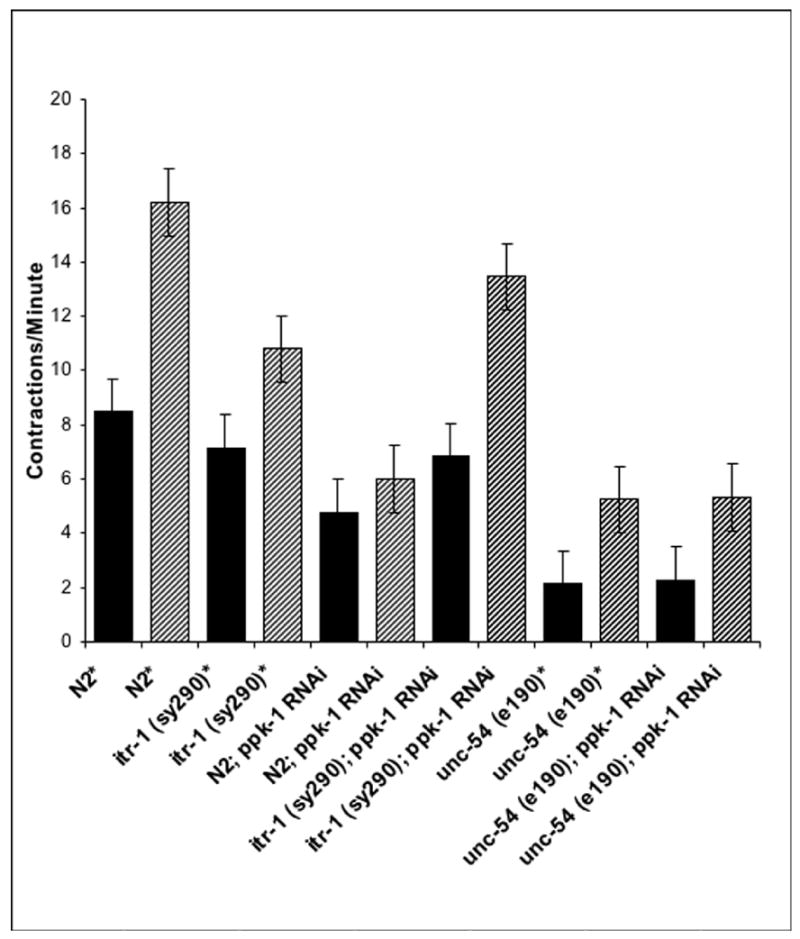
Using video time lapse DIC video microscopy, gonad contractions were counted for 15 minutes. Solid black bars indicate basal contraction rates; diagonal striped bars indicate ovulatory contraction rates. Samples noted by asterisks were treated with pPD129.26 control bacteria: HT115 E. coli transformed with the blank plasmid L4440. Five to six worms were monitored in each experimental group. Error bars indicate standard error of the mean (S. E. M.).