Figure 1.

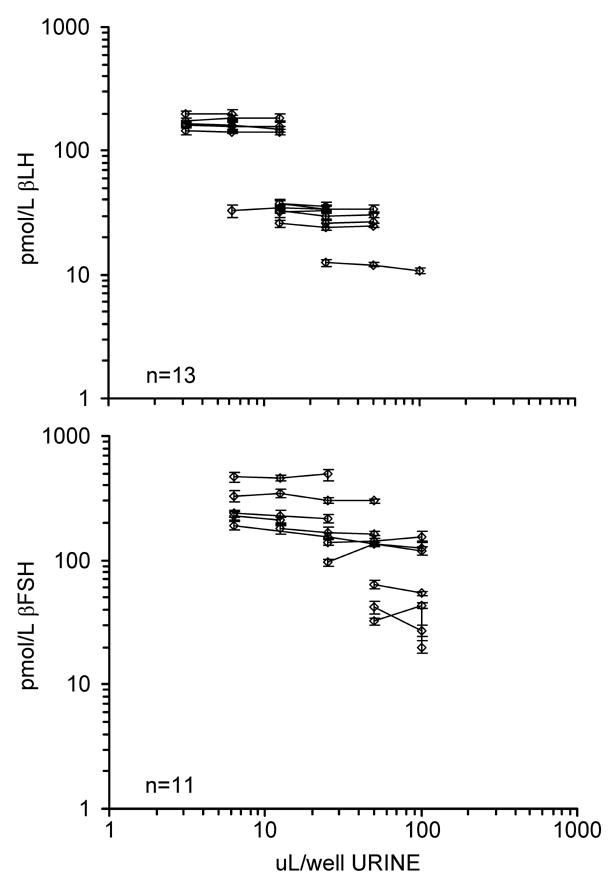
βLH and βFSH assay parallelism. Log concentration of urinary βLH (top panel) and urinary βFSH (bottom panel) plotted against log urine volume. Error bars are ± 2 SE.

βLH and βFSH assay parallelism. Log concentration of urinary βLH (top panel) and urinary βFSH (bottom panel) plotted against log urine volume. Error bars are ± 2 SE.