
Fig. 9.
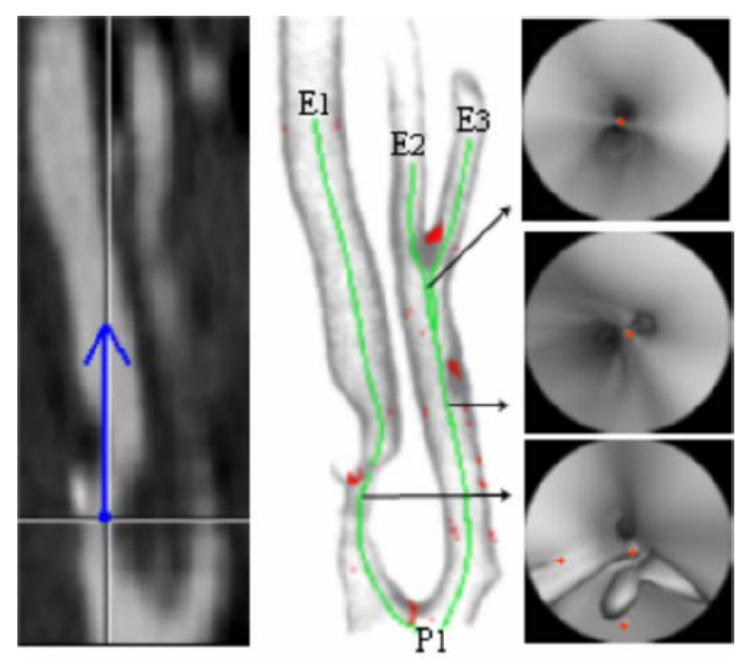
(a) CT slice at a particular position and the representation (blue) of the viewing direction of the virtual angioscope (CT acquisition parameters: 3 mm thickness slices, reconstructed every 1 mm, voxel size: 0. 24 × 0. 24 × 0.24 mm3 after interpolation). (b) Rendering showing the detected 3D surface points, the border points (red) and three virtual paths (green) computed automatically by virtual active navigation (SDT = 100 HU, FOV = 140°, MDS = 1, Nmax = 5,: starting point:P1, target points: E1, E2, E3). (c) Selected virtual angioscopy images with the representation of the border points (red).