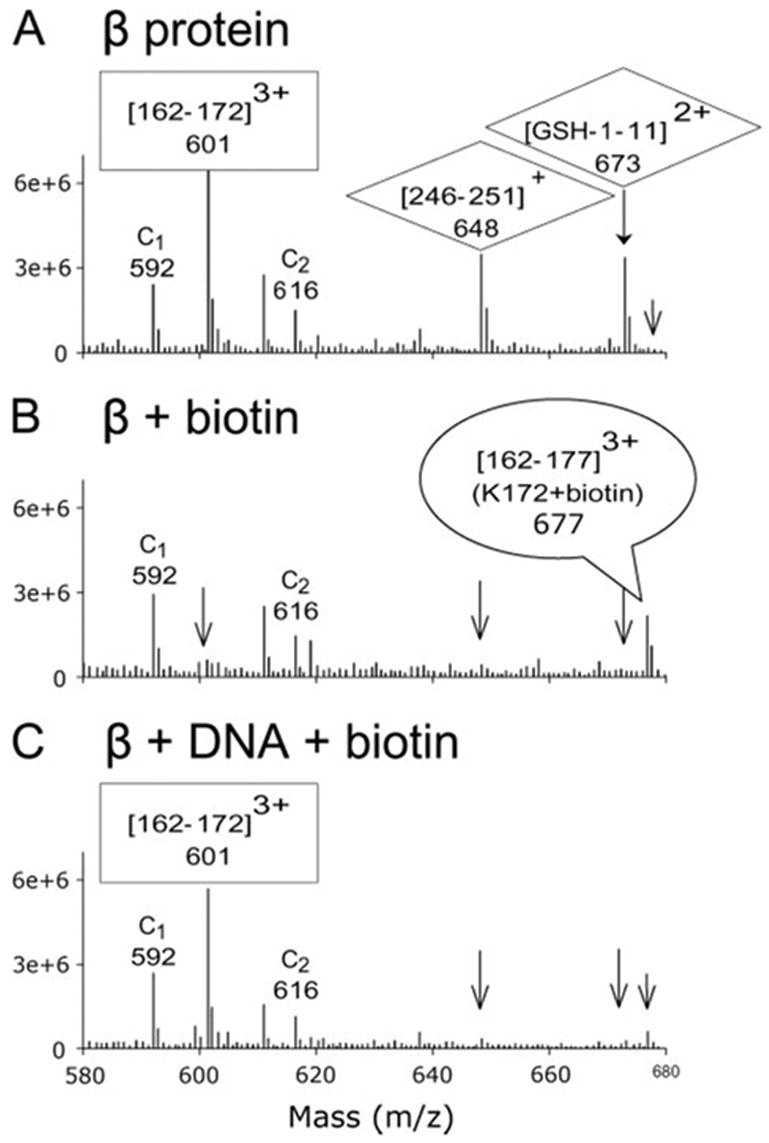
FIGURE 3. Use of mass spectrometry to detect biotinylation of lysine residues and the protection from biotinylation upon DNA complex formation.

Each panel shows an average of a selected region of the spectra taken during the 30–40-min elution times during the LC-MS analysis. The spectra are for β protein alone (A), β protein modified by NHS-biotin (B), and β protein-DNA complex modified by NHS-biotin (C). The peak at m/z 601 in panel A, which corresponds to residues 162–172 of β protein, disappears after biotinylation in panel B since modification of Lys-172 prevents the trypsin digestion necessary to generate this peptide. In addition, a peak at m/z 677 for the triply charged peak of fragment 162–177 with biotin attached to Lys-172 appears upon biotin modification in panel B. For the DNA complex in panel C, the peak at m/z 601 returns, and the peak at m/z 677 is reduced, indicating that DNA binding protects Lys-172 from biotin modification. By the same type of reasoning, Lys-245, Lys-251, and Lys-11 are not protected from biotin modification by DNA binding, since the peaks at m/z 648 and 673 are reduced upon biotinylation of both β protein (panel B) and β protein-DNA complex (panel C). Also seen in the spectra are peaks for two control peptides, C1 at m/z 592 ((16–31)3+, and C2 at m/z 616 ((104–127)3+), which are generated by trypsin cleavage at two arginine residues. Because their MS responses are not affected by biotinylation of lysine residues, they can serve as internal controls for quantitative purposes.
