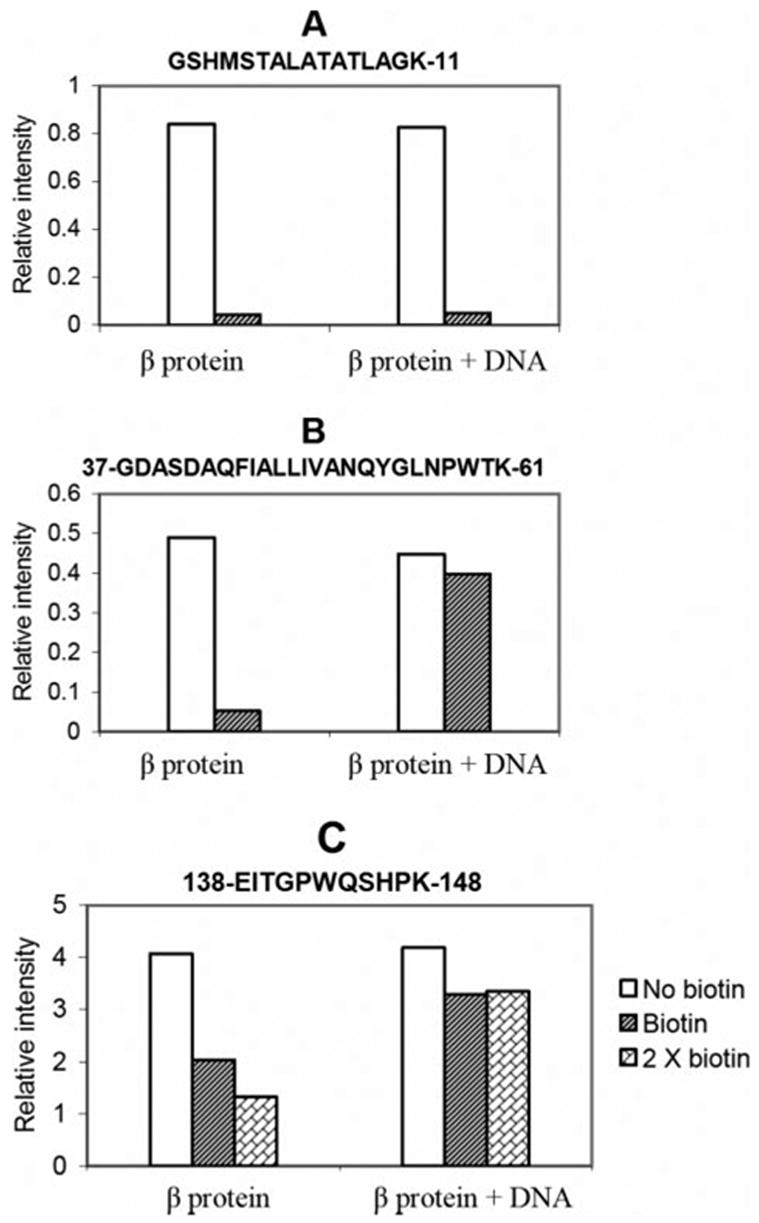
FIGURE 4. Comparison of peak areas of three peptide fragments after biotinylation in the presence and absence of DNA.

The value in the graph is the integrated peak intensity from the extract ion chromatograph of an ion corresponding to the indicated peptide. A, Lys-11 is not protected from biotinylation in the DNA complex, since the peak intensity for this peptide decreases upon biotinylation of free β protein and β protein DNA complex. B, Lys-61 and Lys-36 are protected from biotinylation in the DNA complex, since the peak intensity for this peptide decreases upon biotinylation of free β protein but much less so when the β protein-DNA complex is biotinylated. C, Lys-148 is protected from biotinylation in the DNA complex. The signal for peptide 138–148 is only partially reduced upon biotinylation, indicating low surface accessibility of Lys-148 in the free protein. The signal for this peptide is less reduced upon biotinylation of the DNA complex, indicating Lys-148 is partially protected by DNA. Because the intensity changes for this peptide are less dramatic than those in panels A and B, the analysis was repeated with a 2× dose of NHS-biotin, which results in increased modification of Lys-148 in the free protein but not in the protein-DNA complex.
