
Fig. 2. Characterization of premutation mice generated with the targeting construct shown in Fig. 1.
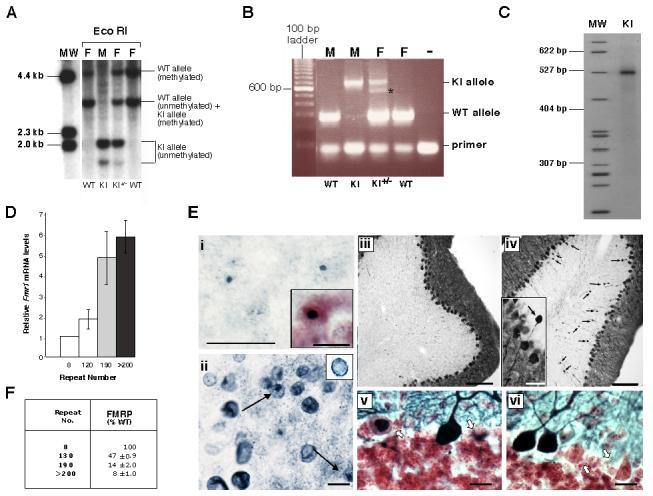
A) Southern blot analysis of Eco RI digested genomic DNA from the tails of WT and KI animals using a probe containing the Eco RI fragment that spans the CGG•CCG-repeat in WT mice (shown at the bottom of Fig. 1). MW, molecular weight marker; M, male; F, female. B) PCR genotyping of mice using frax-c and frax-f primers. Note that in reactions with DNA from females heterozygous for the KI allele, 2 bands are seen in the region expected for the KI allele. Only one band is seen on denaturing gels. The smaller of the 2 bands (indicated by the asterisk) results from a heteroduplex formed between the KI and WT alleles in the last round of the PCR. C) Determination of the repeat size in KI mice using primers frax-m4 and frax-m5. MW, molecular weight marker. D) Relative Fmr1 mRNA levels in 2 month old WT and KI male mice. The difference in RNA levels between WT and KI animals were significant at p<0.0001 by Students t-test. E) CNS pathology in male premutation mice with 120 repeats at ∼100 weeks of age. i) Ubiquitin immunoreactivity in the parafascicular nucleus of the thalamus. (Inset: a section from the reticular formation counterstained with Neutral Red showing a larger inclusion). ii) Lamin immunoreactivity in the nodulus of the cerebellum showing lamin-positive inclusions (arrows) and the irregular distribution of lamin (Inset: cell from WT mice showing the normal lamin distribution on the nuclear periphery) iii-vi) Calbindin immunoreactivity in the cerebellum. iii-iv) Calbindin staining in the cerebellum of WT (iii) and KI (iv) mice. Note that the KI mouse has increased numbers of torpedo axon swellings (arrows in iv). Some are almost as large as the Purkinje soma (iv, inset). v-vi) Cerebellum from KI mice stained for calbindin in blue/black and counterstained with Neutral Red showing Purkinje cells with abnormal calbindin distribution (arrows). In panels i, ii , v and vi the bars indicate 10 μm. The bars in panel iii and iv indicate 100 μm, and the bar in iv (inset) indicates 25 μm. F) Relative FMRP levels in 2 month old WT and KI male mice based on Western blots with FMRP 7G1-1 antibody and normalized using Actin antibodies as described in the text. The data presented represent the results of 3 independent experiments. The difference in protein levels in WT and KI animals were significant at p<0.0001 by Students t-test.