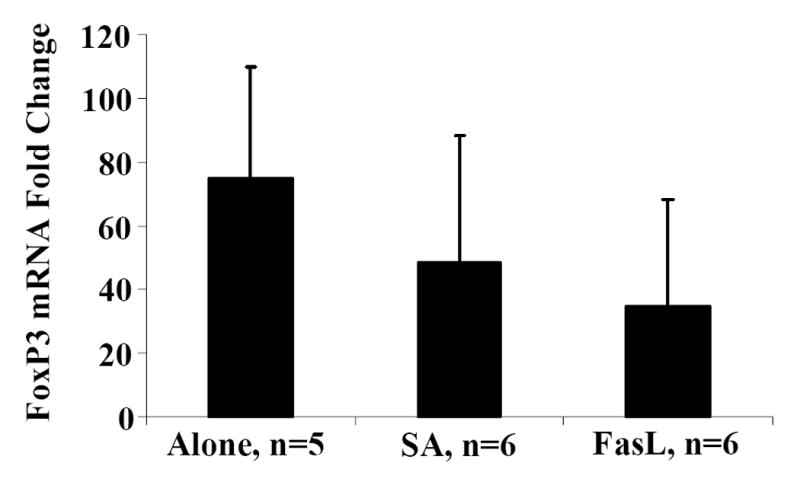
Fig. 2. FoxP3 expression in live CD4+CD25+ T-cells.

Spleens from NOD mice positive for diabetes were harvested, processed, and resuspended at 4×10⁶/mL in complete MLR medium. Splenocytes were bulk cultured and treated with PBS, SA, or SA-FasL for 7.5 hours. Ex vivo treated cultures were washed and stained with a saturating amount of AnnexinV-FITC and T-cell antibodies: CD25-PE and CD4-APC. Using a high speed cell sorter, live (AnnexinV negative) CD4+CD25+ from SA-FasL and control ex vivo treated cultures were sorted and total RNA prepared. CD4+CD25+ and CD4+CD25- T cells from healthy NOD peripheral lymph node were sorted for FoxP3 mRNA controls. cDNA from sorted cells was prepared and then amplified in duplicate by real-time PCR for GAPDH and FoxP3. FoxP3 mRNA levels were normalized relative to GAPDH mRNA expression and statistically analyzed by Kruskal-Wallace test. Data are presented as the fold-change relative to CD4+CD25- T cells. P>0.05.
