
Fig. 3.
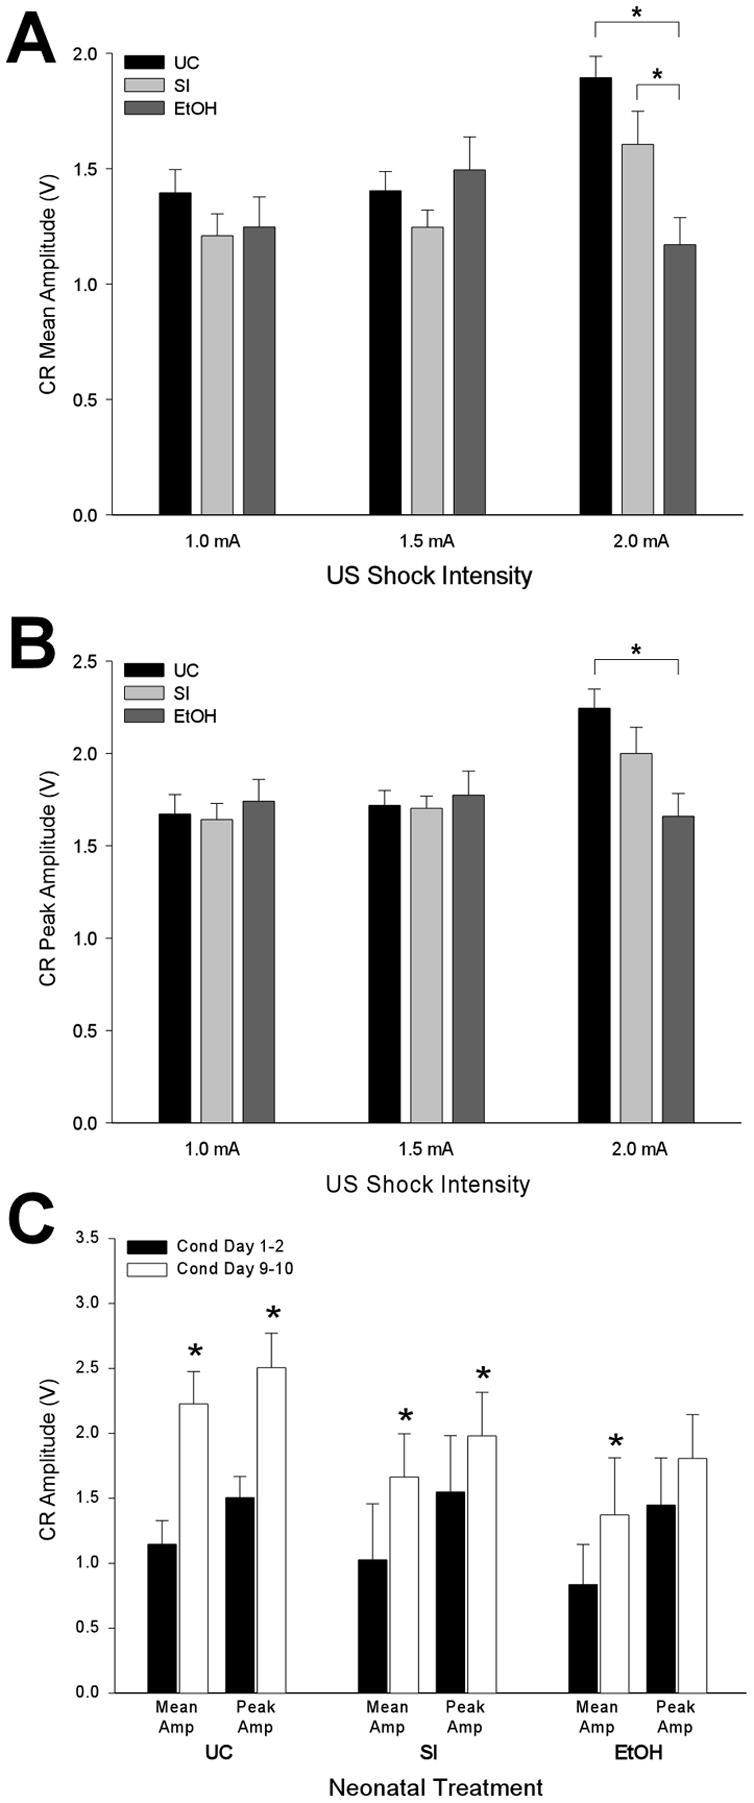
Ethanol-exposure impaired conditioned eyeblink response (CR) amplitudes with the highest but not lower unconditioned stimulus (US) intensities. CR mean (A) and peak (B) amplitudes (± SE) are presented as a function of neonatal treatment and US intensity. (C) CR mean and peak amplitudes (± SE) at the beginning (Cond Day 1–2; black bars) and end (Cond Day 9–10; white bars) of conditioning in rats trained with the 2.0 mA US.