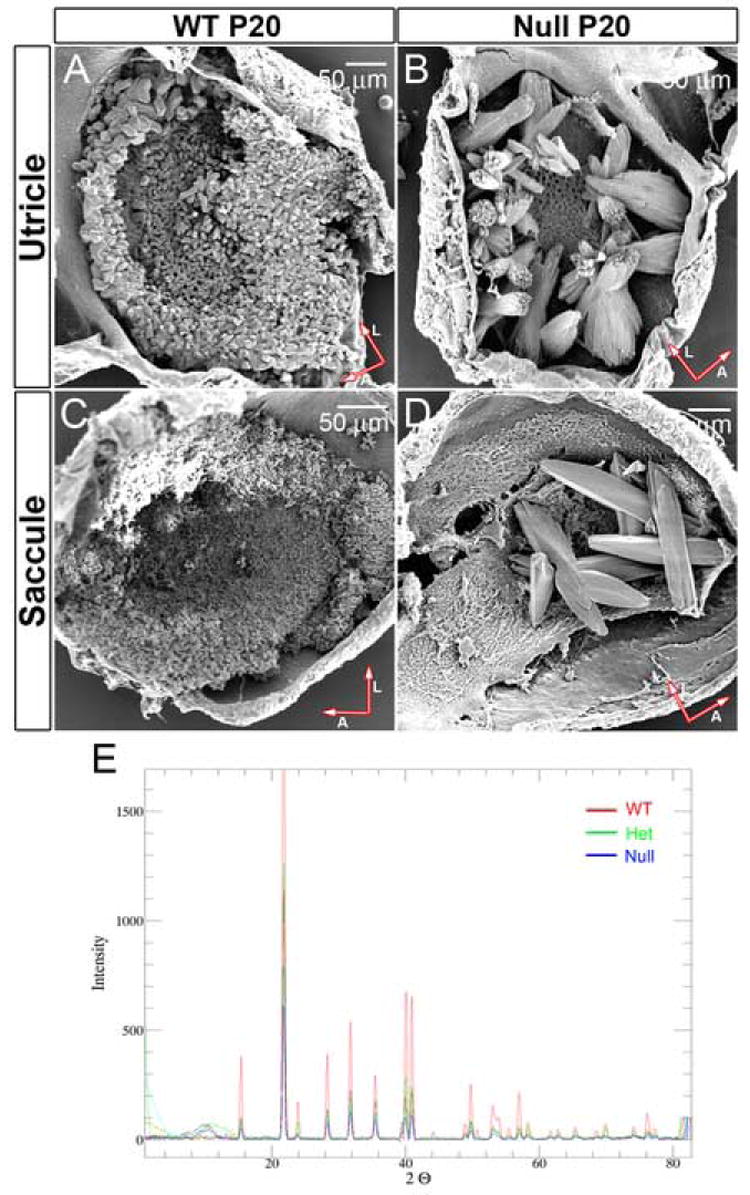
Figure 3. (A, B, C and D) Scanning electron microscopy of Oc90 null and wt otoconia.

A comparison of their sizes is listed in Table 1. The mutant otoconia have surface folds similar to “rock formation” seen in nature. The distortion in otoconia morphology is worse in the utricle than the saccule. Not all null utricles and saccules have as many crystals as shown. Arrows indicate orientation of whole-mount tissues (A, anterior; L, lateral).
(E) X-ray powder diffraction analysis of Oc90 null, het and wt crystalline structures (3 months-old mice). For each sample a series of frames were taken at increments of 10 degrees 2θ while rotating φ. The frames were then merged using the PhaseID module of the Bruker-AXS control program and the resulting pattern of peaks was integrated to produce a powder diffraction pattern. Otoconia from all three genotypes show the same peak distribution pattern of the calcitic crystalline structure. Large variations in the relative peak intensities are expected of samples with a high degree of preferred orientation such as otoconia crystallites.
