
Figure 3. Three-day variability assessment.
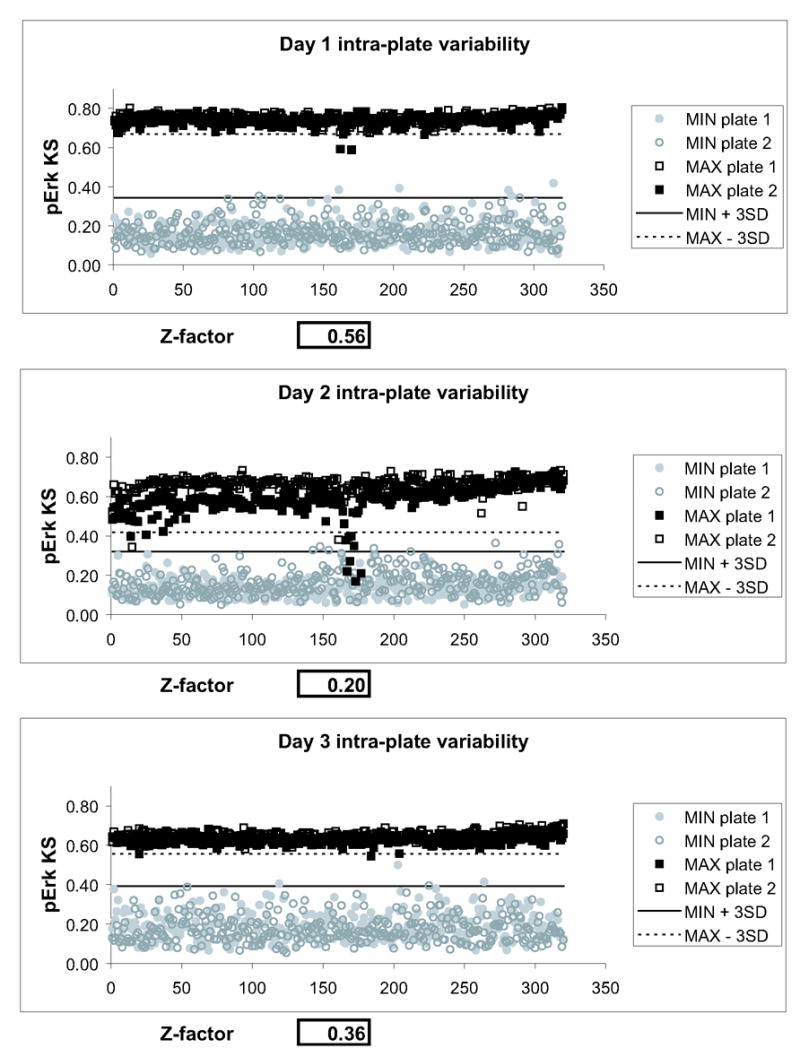
Two plates of minimum (MKP-3 transfected and FITC gated) and maximum (untransfected, ungated) signal were processed on three consecutive days. For each day, minimum and maximum signals from both plates were averaged and Z-factors were calculated. On all three days, the assay showed positive separation bands, as indicated by the solid and dotted lines, which indicate three standard deviations from the means of minimum and maximum signal, respectively. The assay gave Z-factors above 0.2 on all three days. Visual examination of plate graphs demonstrated a systematic error in one of the center rows of plate #1 on day 2, which was due to a clogged dispense nozzle on one of the liquid handlers.