
Figure 1.
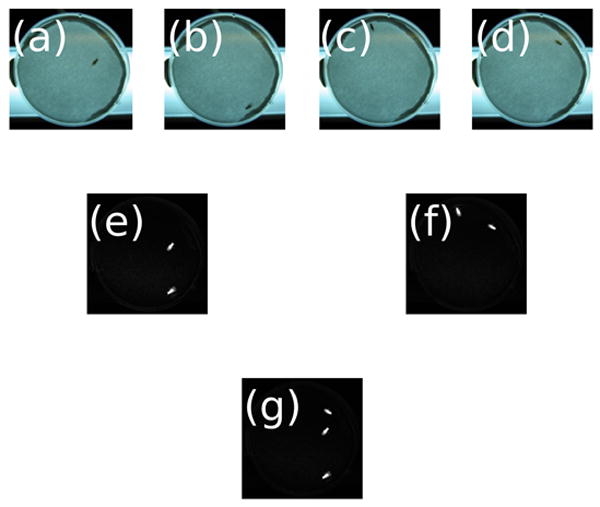
The sliding window method shows movement of a single fly. The four images on the top row (a–d) represent a single fly in a shallow dish at four consecutive time points. Digitally subtracting (a) from (b) yields (e) and digitally subtracting (c) from (d) yields (f). The background disappears and white files on a black background show that movement took place. Digitally subtracting (e) from (f) gives (g), an image where the four white flies represent the fact that two movements occurred during the interval measured (the maximum possible).