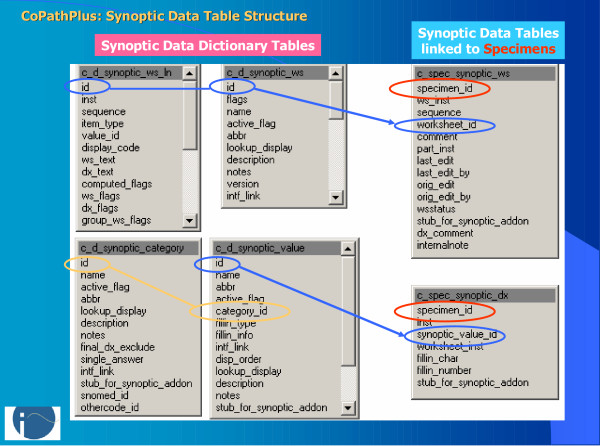
Figure 2.

CoPathPlus synoptic table structure: Tables on the left contain the defined synoptic templates, and structured categories and values applied to templates. Tables on the right contain template-level data and values selected for distinct specimens, with links between the tables indicated by colored lines.
