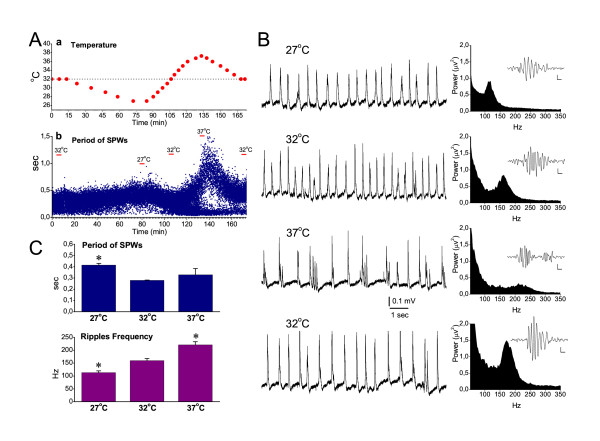
Figure 2.
Effects of temperature on SPWs and ripple oscillation. A. Representative experiment showing the time course of the temperature changes (a) and the induced fluctuations in the period of SPWs recorded from the CA1 pyramidal layer (b). The dotted line in "a" marks the temperature of 32°C. In "b", the three representative temperatures (32°C, 27°C and 37°C) are indicated for purpose of comparison. During the increase of the temperature from 34–35°C to higher values, the histogram of the period bifurcated. This deviation of the values was due to the fact that SPWs were frequently generated in a burst-like fashion (shown in B), where consecutive waves appeared at short intervals, whereas at the same time the period between bursts of events increased. B. Continuous recording of SPW-R complexes (left column) and power spectra at the high frequency range (right column) obtained at different temperatures. Single ripple episodes (band-pass filtered traces) are shown as inserts in spectral plots; calibration bars: 10 μV, 10 ms. At 37°C SPWs appeared frequently as bursts of several events. Ripple frequency changed monotonically with temperature. Note that at 37°C ripple frequency exceeded 200 Hz. Data in "A" an "B" were collected from two different slices. C. Collective date of the period of SPWs and of the frequency of ripple oscillation at three different temperatures. Asterisks indicate significant differences with reference to the group of 32°C (paired t-test, at P < 0.05, n = 4).

