
Figure 1.
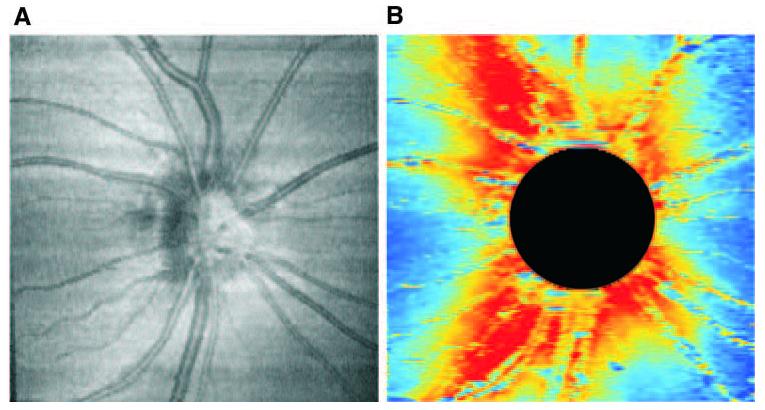
(A) hsUHR-OCT en face fundus image. (B) RNFL thickness map. Red: increased RNFL thickness; blue: decreased thickness. The ONH region (circle) was excluded from RNFL analysis.
Official websites use .gov
A
.gov website belongs to an official
government organization in the United States.
Secure .gov websites use HTTPS
A lock (
) or https:// means you've safely
connected to the .gov website. Share sensitive
information only on official, secure websites.
(A) hsUHR-OCT en face fundus image. (B) RNFL thickness map. Red: increased RNFL thickness; blue: decreased thickness. The ONH region (circle) was excluded from RNFL analysis.