
Figure 6.
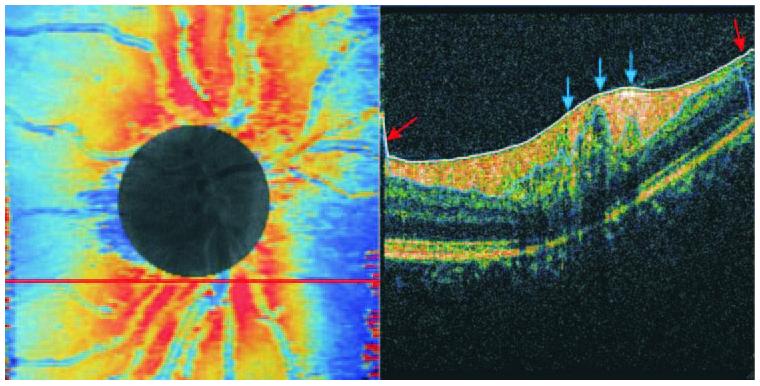
Algorithm failure. RNFL thickness map, where red marks the areas of the thicker RNFL and blue the thinner areas (left). The circle covers the ONH. A cross-sectional scan (right) was taken along the red line just under the disc margin. Red arrows: RNFL border detection algorithm failure toward the edge of the OCT image, where the signal was weaker. Blue arrows: an area just outside the ONH border where several blood vessels were located and the RNFL was thinner.