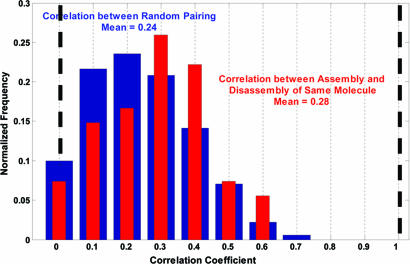
Fig. 3.
Statistical correlation analysis of the MuB–DNA cluster patterns formed in the assembly and disassembly phases. The blue bars show the distribution of the correlation coefficients among random pairs of all the patterns analyzed, and the red bars show the distribution among matched pairs on the same target molecules before and after brief saturation with EGFP–MuB.

