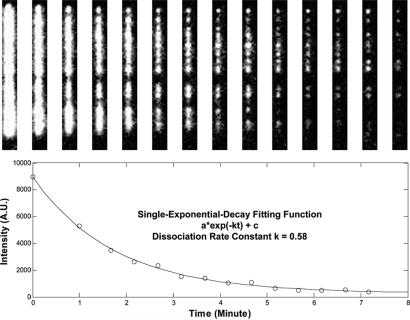
Fig. 4.
Measurement of the MuB dissociation rate constant from single target molecules. (Upper) Time-lapsed fluorescence images of an individual target molecule. (Lower) Corresponding MuB dissociation curve based on the fluorescence intensity in Upper. The line is a single-exponential decay fit used to estimate the apparent dissociation rate constant.

