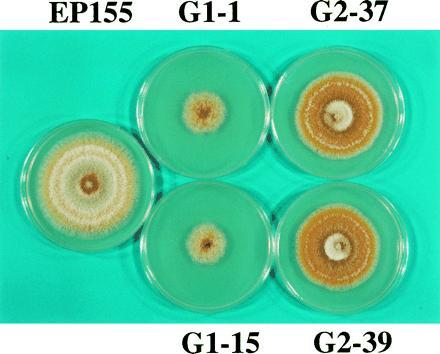
Figure 3.

Colony morphology of wild-type strain EP155, cpg-1 disruption mutants G1-1 and G1-15 and cpg-2 disruption mutants G2-37 and G2-39. When grown on PDA, disruptants G1-1 and G1-15 grew much more slowly than control strain EP155, whereas G2-37 and G2-39 had only a slightly reduced growth rate. Orange pigmentation was also reduced for cpg-1 disruptants G1-1 and G1-15, but the cpg-2 disruptants G2-37 and G2-39 had slightly increased orange pigmentation in comparison to EP155.
