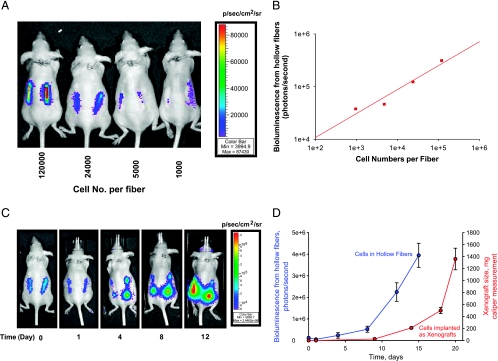
Figure 2.
Proliferation of MAT B III-Luc-3H9 cells determined by bioluminescence imaging in hollow fibers. (A) Bioluminescence imaging of nude mice harboring hollow fibers filled with indicated numbers of MAT B III-Luc-3H9 cells per fiber. (B) Linear correlation between bioluminescence and the numbers of cells implanted. (C) Longitudinal bioluminescence imaging of a representative mouse was acquired on the days indicated after hollow fiber implantation. (D) Mean bioluminescent flux (photons/sec) was obtained from 10 hollow fibers in five mice (each bearing two hollow fibers; blue line), and mean tumor volume was determined with caliper measurement in a tumor xenograft (mean from 10 tumors in five mice; red line) (error bars represent the standard error of the mean).

