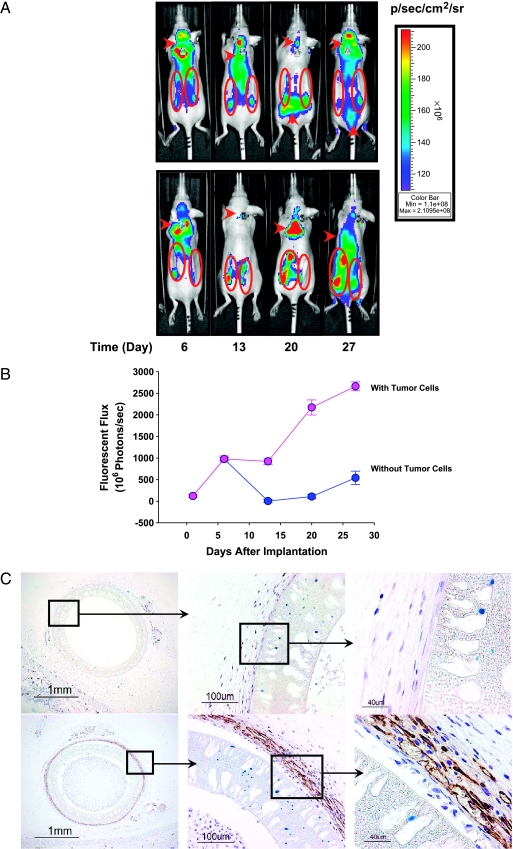
Figure 3.
Detection of angiogenesis around hollow fibers. (A) Fluorescent images acquired 24 hours after the intravenous administration of AngioSense750 into nude mice harboring hollow fibers without tumor cells (upper panel, ROI encircled) and with MAT B III-Luc-3H9 tumor cells (24,000 cells/fiber; lower panel, ROI encircled). (B) Average fluorescence imaging (photons/sec) was calculated from six hollow fibers in three mice (error bars represent the standard error of the mean). (C) CD31 immunohistochemical staining in hollow fiber sections on day 28 (upper panel, no tumor cells; lower panel, with tumor cells). Magnification is shown on the lower left corner.

