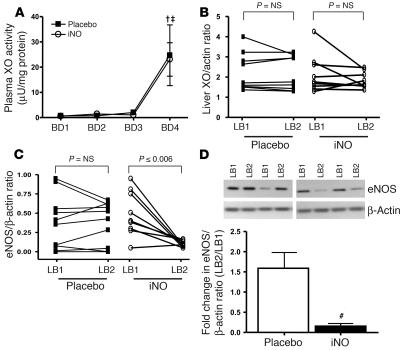
Figure 3. Effects of iNO on ROS and RNS metabolism.
(A) Plasma XOR activities as a function of blood draws during surgery. †P ≤ 0.05, BD4 relative to BD1 for placebo; ‡P = < 0.001, BD4 relative to BD1 for iNO by repeated-measures ANOVA with Tukey post-hoc analysis. (B) Changes in hepatocellular expression of XOR (normalized to β-actin) before and 1 hour after reperfusion. (C) Changes in hepatic expression of eNOS (normalized to β-actin) before and 1 hour after reperfusion. P values represent significance calculated by paired t test. n = 10, placebo; n = 9, iNO. Inset in D shows representative Western blots showing changes in eNOS in paired (LB1-LB2) samples from 2 patients in each group. (D) Average fold change in eNOS expression. #P ≤ 0.004 relative to placebo.

